Categories: Print & Editorial Design, Infographics, Web Design & UX/UI, Motion Design
Brief
Wings needed to effectively communicate their performance results to stakeholders through both traditional printed materials and an engaging interactive online experience. The challenge was to transform complex data into accessible, visually appealing narratives that would resonate with diverse audiences while maintaining brand consistency across different formats.
Solution
I approached this project as an integrated communication solution, creating complementary printed and digital experiences that shared a unified visual language while leveraging the unique strengths of each medium.

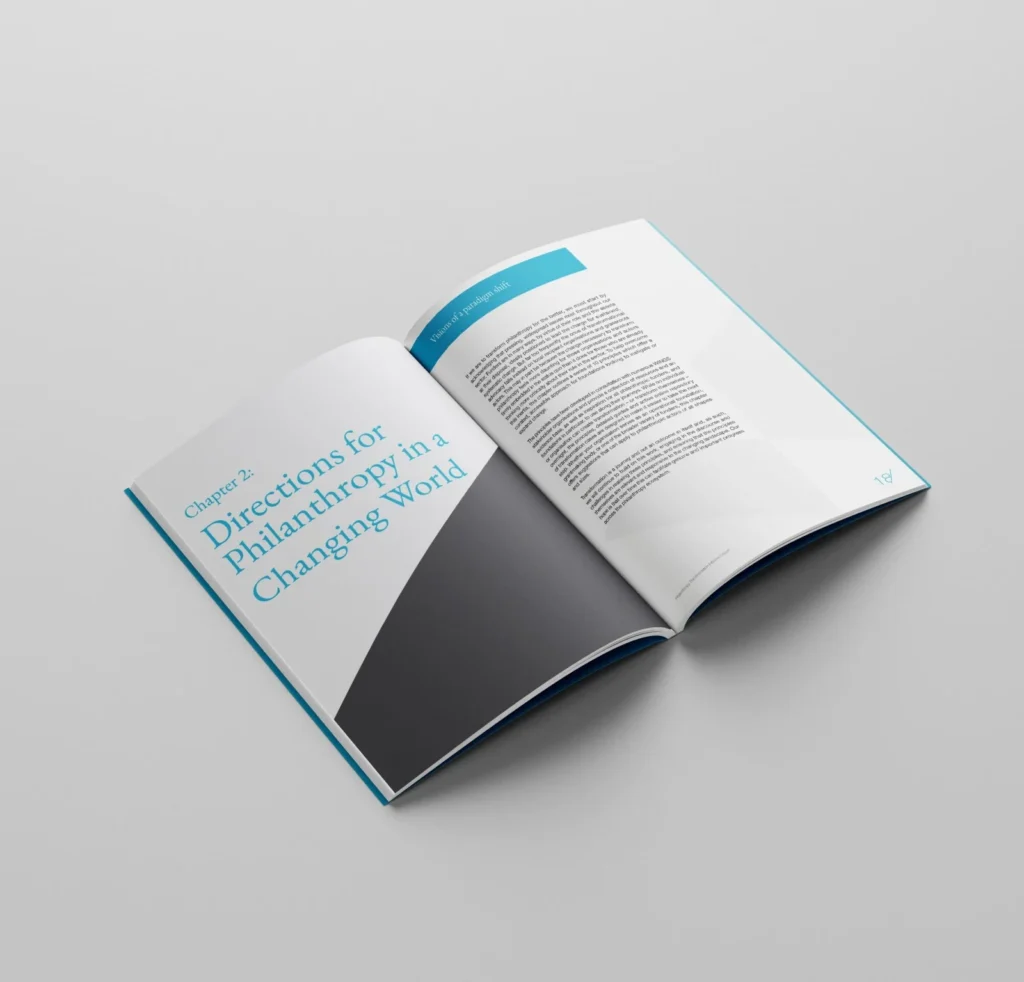
Printed Results Report
For the printed report, I focused on creating a premium physical experience that conveyed the significance of the results:
- Developed a sophisticated layout system using a modular grid that allowed for flexible presentation of different data types
- Created custom data visualizations that transformed abstract numbers into intuitive visual stories
- Implemented strategic use of color to highlight key performance indicators and guide readers through complex information
- Selected premium paper stocks and printing techniques that reinforced the quality of the content
- Designed a hierarchical typography system that improved readability and information retention
- Incorporated thoughtful white space to prevent information overload and emphasize key findings
The final printed report served both as a comprehensive record of results and as a prestigious brand artifact that stakeholders would want to keep and reference.
Interactive Online Report
For the digital version, I created an immersive interactive experience that allowed users to explore the data at their own pace and according to their specific interests:
- Designed an intuitive navigation system that balanced guided storytelling with user-directed exploration
- Developed animated data visualizations that revealed insights progressively, enhancing understanding
- Created interactive elements that allowed users to filter and compare different metrics
- Implemented responsive design principles ensuring perfect presentation across all devices
- Used subtle motion design to draw attention to key information and enhance engagement
- Incorporated shareable components allowing stakeholders to extract and share specific insights
The online report transformed what could have been a static presentation into an engaging, interactive experience that increased both comprehension and time spent with the content.
Challenges
The primary challenge was maintaining a unified narrative and visual identity across two fundamentally different mediums. I addressed this by developing a core design system that could be adapted to both formats while taking advantage of the unique capabilities of each.
Another significant challenge was translating complex data into accessible visualizations without oversimplifying or misrepresenting the information. I collaborated closely with the Wings analytics team to ensure accuracy while creating visuals that would be meaningful to non-technical audiences.
The interactive report presented technical challenges in balancing sophisticated animations with performance requirements. I implemented progressive enhancement techniques that provided rich experiences for capable devices while ensuring essential information remained accessible on all platforms.
